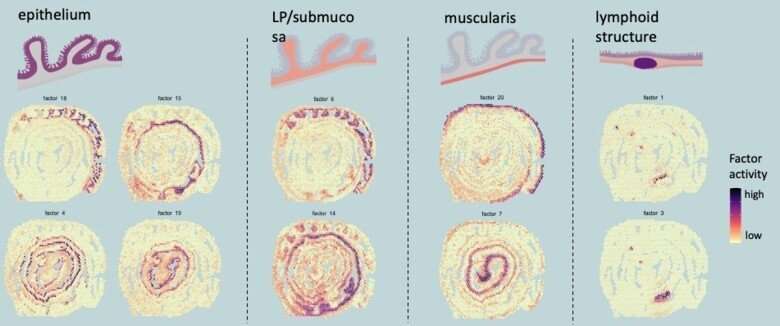
Using a technique called spatial transcriptomics, researchers at Karolinska Institutet have analyzed the gene expression in the mouse colon and created a map showing where in the tissue individual genes are expressed. When they superimposed previously known human transcription data onto the map, the researchers gained new insights into inflammatory bowel disease (IBD). The study is published in the journal Nature Communications.
The group used a technique known as spatial transcriptomics (ST) to map the gene activity of individual cells in the murine colon. According to the researchers, this is the first time anyone has been able to visualize the gene expression landscape of the entire intestine, in health and recovery after injury.
“Our spatial transcriptomics-driven visualization enabled us to discover several previously unknown aspects, such as that the colon is divided into more segments than once thought,” says the study’s corresponding author Eduardo J. Villablanca, docent at the Department of Medicine, Solna at Karolinska Institutet.
When the results were combined with known transcription data from human tissue, the scientists noticed that the location of certain intestinal cells was the same in both mice and humans, which makes the model a tool for understanding how different diseases, such as IBD, affect the colon.
In an earlier study, Eduardo J. Villablanca’s research group showed that ulcerative colitis can be divided into two subgroups with different gene expressions. With reference to the new map, they were able to show that the genes for the more difficult to treat forms of the disease were found in tissue that was also more damaged.
“Similarly, the gene map can be used to see where in the colon human cells are active, which can make a significant contribution to the development of new treatments and drugs,” Villablanca says.
Technique applied in a novel way
Spatial transcriptomics was developed at SciLifeLab by scientists from KTH Royal Institute of Technology and Karolinska Institutet. It allows the visualization of gene expression in the tissue. However, to visualize a long tubular organ like the colon, the researchers behind this study applied the technique in a novel way. By rolling up the colon like a Swiss roll, they managed to fit and map the entire gene expression landscape of a long organ.
“We now want to use the same method to create a similar atlas for all digestive organs, from the mouth to the rectum,” Villablanca explains. “Our aim is to create a reference map for the gene expression of all these tissues.”
Source: Read Full Article